Posterior sampling
This page provides an overview of sampling the posterior of a
statistical fit with ds.inference.sample. Throughout, we sample the posterior of an adsorption-diffusion model,
a rod that loses solute to a saturating sink,
with \(u(0, t) = 0\), \(u(1, t) = 1\), \(u(x, 0) = x\), \(D = 0.3\), and \(a = 1\), observed at five times between \(t = 0.05\) and \(t = 1.5\) with noise of scale \(10^{-1}\), and with a normal prior on each of the two parameters:
import jax

jax.config.update("jax_enable_x64", True)

import jax.numpy as jnp
import numpy as np

import diff_soup as ds
from diff_soup.domains import cartesian_grid_1d

n = 32
spec = ds.problem("adsorption")
spec.domain("rod", cartesian_grid_1d(n, 0.0, 1.0, method="fvm"))
spec.field("u", mass="differential", scale=1.0, init=lambda x: x)
spec.param("D", value=0.3)                                            # the generating diffusivity
spec.param("a", value=1.0)                                            # the generating adsorption rate


@spec.equation(writes="u", reads=("u",))
def adsorption(q):
    return q.p.D * q.ops.laplacian(q.u) - q.p.a * q.u / (1.0 + q.u)


spec.bc.dirichlet("u", node_indices=np.array([0]), value=0.0)
spec.bc.dirichlet("u", node_indices=np.array([n - 1]), value=1.0)
problem_true = spec.build()
y0 = spec.assemble_state({})
solver = ds.JIDA()

ts = jnp.array([0.05, 0.15, 0.3, 0.5, 1.5])
sol_true = ds.pdesolve(problem_true, solver, (0.0, 1.5), y0, saveat=ds.SaveAt(ts=ts))
data = sol_true.ys + 1e-1 * np.random.default_rng(0).standard_normal(sol_true.ys.shape)
The posterior
During maximum a posteriori estimation (statistical estimation), we seek to maximize the posterior
and obtain an optimal value \(\theta_{\text{MAP}}\). In order to quantify the uncertainty in our estimate \(\theta_{\text{MAP}}\), we need to estimate the full posterior distribution. The Laplace approximation (standard errors and covariance) estimates it by a Gaussian centered on \(\theta_{\text{MAP}}\), with the curvature of the negative log posterior there as its inverse covariance. For nonlinear problems this can fail, as shown below for the diffusivity of the adsorption-diffusion model:
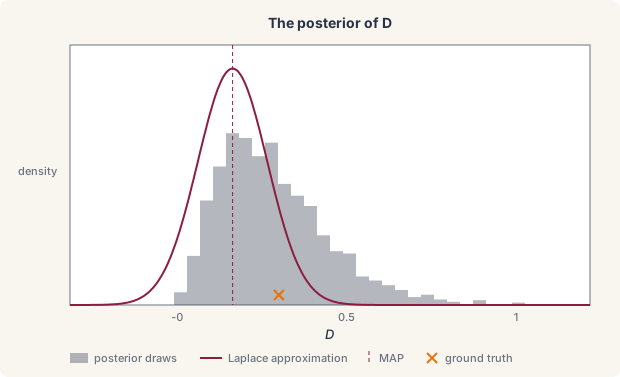
Instead, we can sample from the full posterior using Markov chain Monte Carlo methods provided by blackjax. We can draw samples from the full distribution in order to carry out a variety of uncertainty quantification tasks: assign credible intervals to each parameter, compute posterior means and correlations, propagate the parameter uncertainty to a band around the predicted solution, and carry it through the coefficients of a parameterized function (function approximation) to a band around the function itself. In this page we describe the process of posterior sampling in diff-soup and the typical workflows for PDE inference problems. The full sampling run:
spec = ds.problem("adsorption")
spec.domain("rod", cartesian_grid_1d(n, 0.0, 1.0, method="fvm"))
spec.field("u", mass="differential", scale=1.0, init=lambda x: x)
D = spec.param("D", value=0.1, learnable=True, bounds=(0.01, 2.0),
               prior=ds.inference.NormalPrior(mean=0.3, scale=0.3))        # the learnable diffusivity and its prior
a = spec.param("a", value=0.5, learnable=True, bounds=(0.0, 5.0),
               prior=ds.inference.NormalPrior(mean=1.0, scale=1.0))        # the learnable adsorption rate and its prior


@spec.equation(writes="u", reads=("u",))
def adsorption(q):
    return q.p.D * q.ops.laplacian(q.u) - q.p.a * q.u / (1.0 + q.u)


spec.bc.dirichlet("u", node_indices=np.array([0]), value=0.0)
spec.bc.dirichlet("u", node_indices=np.array([n - 1]), value=1.0)
problem = spec.build()
y0 = spec.assemble_state({})

measurement = ds.inference.Measurement("u", times=ts, values=data,
                                       likelihood=ds.inference.Gaussian(sigma=1e-1))
experiment = ds.inference.Experiment(model=problem, solver=solver, t_span=(0.0, 1.5),
                                     initial_state=y0, measurements=(measurement,))
est = ds.inference.InferenceProblem(experiment, parameters=(D, a), objective=ds.inference.MAP())   # the MAP problem
fit = ds.inference.optsolve(est, ds.inference.LevenbergMarquardt())                            # its mode

draws = ds.inference.sample(est, fit, key=jax.random.PRNGKey(0), chains=2, draws=1000, warmup=300)   # draw from the posterior
report = ds.inference.mcmc_report(draws)                                                 # check the draws
draws[D]                                                                                 # the draws of D
Sampling the posterior
To sample the posterior, we run a sampler on the MAP problem and its
fit with ds.inference.sample, and check the draws with
ds.inference.mcmc_report.
Run the sampler
ds.inference.sample(problem, fit, *, kernel="nuts", chains=4,
draws=1000, warmup=200, adapt="pooled", mass="diag", step_size=None,
max_tree_depth=10, key, preconditioner="laplace", curvature="observed",
nuts_target_acceptance=0.8, chain_map=None)
runs one chain
per chains on the posterior of the MAP problem and returns the draws.
An MLE problem is refused, since it has no prior.
draws = ds.inference.sample(est, fit, key=jax.random.PRNGKey(0), chains=2, draws=1000, warmup=300)
fitis the MAP fit the chains start from.keyis the random key. The same key reproduces the same draws.kernel="nuts"is the No-U-Turn sampler and the default. It follows the gradient of the posterior and adapts its step size and scale during the warmup.kernel="rmh"is the random-walk Metropolis kernel, which proposes Gaussian steps of a fixed size and needs no gradient. Any other name is refused.chains=is the number of chains. Each starts from the fit plus random noise of half a standard deviation of the Laplace approximation per coordinate (half a unit without the preconditioner below), so the starts lie inside the posterior.draws=is the number of draws kept per chain, andwarmup=the number of steps before them. The random-walk chains discard their warmup steps. NUTS chains adapt during them and keep their last state, so the kept draws start adapted.adapt=is how NUTS adapts."pooled"adapts one step size and one mass matrix from all chains at once, with the ChEES method of Hoffman et al. (2021) (references), so no single chain's noise sets them."window"adapts each chain on its own with Stan's window schedule."step_size"adapts only the step size and keeps the unit scale of the Laplace preconditioner, andNoneruns atstep_size. One chain, or chains that do not run as one batched call, adapt as"window".mass="diag"adapts a diagonal mass matrix."dense"adapts a full one, withadapt="window"and at most 50 parameters.step_size=is the step size adaptation starts from, 1.0 whenNone, and the fixed one withadapt=None.max_tree_depth=10is the most times a NUTS trajectory doubles in one draw.preconditioner="laplace"scales the proposals of either kernel by the Laplace approximation of standard errors and covariance, so that the chains move at the width of the posterior from the first step.Noneruns the chains without it.curvature="observed"is the default curvature of that Laplace approximation."expected"uses the expected curvature instead.nuts_target_acceptance=0.8is the acceptance rate NUTS adapts its step size toward during the warmup.chain_map=places the chains. The default runs them as one batched call."sequential"runs them one after another."devices"places whole chains on the local devices, withchainsa multiple of the device count.draws.chain_maprecords the placement that ran.- A parameter with bounds is sampled in an unbounded coordinate, and every draw is returned in the parameter's own coordinate.
Analyze the draws
The draws are returned in the parameters' own coordinate, one array
over the chains, the draws, and the parameters, and draws[D] returns
the draws of one parameter.
draws.values.shape       # (2, 1000, 2), the chains, the draws, and the parameters
draws[D]                 # the draws of D, over the chains and the draws
draws.names              # the parameter labels
draws.info               # the acceptance rate and, for NUTS, the divergences per draw
predictive = ds.inference.predict(est, draws, kind="predictive")["u"]   # the solution over the draws, with noise
draws.valuesholds the draws anddraws.nameslabels them.draws[D]returns the draws of one parameter, and a dictionary by cluster for a parameter that varies by cluster (hierarchical fits).draws.infoholds one value per draw ofacceptance_rate, and for NUTSis_divergentandnum_integration_steps. For NUTS,draws.info["adaptation"]records themethodthat ran, the adaptedstep_sizeof each chain, themass, themax_tree_depth, thewarmupand the meanacceptance_rateof the kept draws.ds.inference.predict(problem, draws, kind=)solves the model at every draw and summarizes the predicted values, the sampled counterpart of the prediction bands.
Whether the draws represent the posterior is the question of diagnostics, checked before any summary is taken.
Diagnostics
A chain represents the posterior only once it has forgotten its
starting point and visited the posterior in proportion to its
density, and a finite number of correlated draws carries less
information than the same number of independent ones.
ds.inference.mcmc_report(draws, *, rhat_max=1.01, ess_floor=400.0)
checks both and flags the failures in words. Each chain needs at
least eight draws.
report = ds.inference.mcmc_report(draws)
report.rhat              # near one when the chains agree
report.ess_bulk          # the number of independent draws the chains are worth
report.flags             # the failed checks in words, empty here
report.ok                # whether every check passed, True here
print(report.summary())  # the table of the above
rhatcompares the spread within each chain to the spread between them, per parameter, and is near one when the chains agree. It is flagged aboverhat_max.ess_bulkandess_tailare the effective sample sizes for the center and for the tails of the posterior, the number of independent draws the chains are worth. Each is flagged belowess_floor.mean,sd, andmcse_meanare the posterior mean, the posterior standard deviation, and the Monte Carlo error of the mean, per parameter.acceptance_rateandacceptance_rate_per_chainsummarize the proposals, and for NUTSn_divergent,divergences_per_chain,tree_depth_max, andtree_depth_meansummarize the integration.flagslists the failed checks,okisTruewhen it is empty, andsummary()renders a table of the above as text.
The diagnostics are the rank-normalized split \(\hat R\) and effective sample sizes of Vehtari et al. (2021) (references).
Preconditioning
The random-walk kernel steps with a fixed size, so it moves well only
in a coordinate where the posterior has unit scale, and NUTS adapts
faster from one. The default preconditioner="laplace" builds that
coordinate from the Laplace approximation of
standard errors and covariance,
the affine map \(w \mapsto c + A w\) with \(c\) the mode and
\(AA^\top\) the covariance, and runs the chains in \(w\). A Laplace
approximation with an undetermined direction, from
ds.inference.laplace(on_singular="subspace"), cannot precondition
the chains (identifiability). For example, the
random-walk kernel with and without it:
draws_rmh = ds.inference.sample(est, fit, key=jax.random.PRNGKey(0), kernel="rmh",
                                chains=2, draws=300, warmup=100)
draws_raw = ds.inference.sample(est, fit, key=jax.random.PRNGKey(0), kernel="rmh",
                                chains=2, draws=300, warmup=100, preconditioner=None)
ds.inference.mcmc_report(draws_rmh).acceptance_rate      # the fraction of proposals accepted
ds.inference.mcmc_report(draws_raw).acceptance_rate
Credible bands for fitted functions
A learnable function of function approximation is fitted through its coefficients, so its draws are coefficient vectors, and a credible band for the function follows by evaluating it at every draw. For example, with the diffusivity of the adsorption model allowed to vary along the rod as a Legendre expansion:
from diff_soup.inference.approx import Legendre

spec_f = ds.problem("adsorption_function")
spec_f.domain("rod", cartesian_grid_1d(n, 0.0, 1.0, method="fvm"))
spec_f.field("u", mass="differential", scale=1.0, init=lambda x: x)
D_of_x = spec_f.function("D_of_x", Legendre(jnp.array([np.log(0.3), 0.0, 0.0]), interval=(0.0, 1.0),
                                             transform=lambda x, p: jnp.exp(p)),
                         learnable=True, prior=ds.inference.GaussianCoefficientPrior(scale=1.0))   # a diffusivity along the rod and its prior
a_f = spec_f.param("a", value=0.5, learnable=True, bounds=(0.0, 5.0),
                   prior=ds.inference.NormalPrior(mean=1.0, scale=1.0))


@spec_f.equation(writes="u", reads=("u",))
def adsorption_f(q):
    return q.ops.div_flux(q.fn.D_of_x(q.x[:, 0]), q.u) - q.p.a * q.u / (1.0 + q.u)


spec_f.bc.dirichlet("u", node_indices=np.array([0]), value=0.0)
spec_f.bc.dirichlet("u", node_indices=np.array([n - 1]), value=1.0)
problem_f = spec_f.build()
est_f = ds.inference.InferenceProblem(
    ds.inference.Experiment(problem_f, solver, (0.0, 1.5), spec_f.assemble_state({}), (measurement,)),
    parameters=(D_of_x, a_f), objective=ds.inference.MAP())
fit_f = ds.inference.optsolve(est_f, ds.inference.LevenbergMarquardt())
draws_f = ds.inference.sample(est_f, fit_f, key=jax.random.PRNGKey(0), chains=2, draws=500, warmup=300)

coeffs = draws_f[D_of_x].reshape(-1, 3)                                              # one coefficient vector per draw
xs = jnp.linspace(0.0, 1.0, 101)
curves = jax.vmap(lambda c: Legendre(c, interval=(0.0, 1.0), transform=lambda x, p: jnp.exp(p))(xs))(coeffs)   # D(x) at every draw
lower, upper = jnp.percentile(curves, jnp.array([2.5, 97.5]), axis=0)                # the pointwise 95% credible band
draws[handle]on a function handle returns the draws of its coefficients, one row per draw after the reshape, in the order of the expansion.- The band is pointwise, one interval per position, and the same
percentiles over
curvesgive the band of any transform of the function.
References
- A. Vehtari, A. Gelman, D. Simpson, B. Carpenter, and P.-C. Bürkner. Rank-normalization, folding, and localization: an improved \(\hat R\) for assessing convergence of MCMC (with discussion). Bayesian Analysis, 16(2):667–718, 2021. doi:10.1214/20-BA1221.
- M. D. Hoffman, A. Radul, and P. Sountsov. An adaptive-MCMC scheme for setting trajectory lengths in Hamiltonian Monte Carlo. Proceedings of AISTATS, PMLR 130:3907–3915, 2021. proceedings.mlr.press/v130/hoffman21a.